The split of files in fragments can have serious impact on the performance of the Notes client or the Domino server. So it is very important to control the framgentation of the installation directory of Notes Domino and the data directories. The on board defrag tool of Windows is often not much help, because it can only defrag the whole harddisk and it cannot generate a report to show which file are fragmented and which are not. But Microsoft provides a tool which can analyze single files, directories or whole directory trees. It is called contig.exe. Contig.exe can be downloaded from http://technet.microsoft.com/en-us/sysinternals/bb897428.aspx.
The download contains one file (contig.exe) which should be extracted to a directory contained in the Windows path for example "c:\windows\system32". To analyze the fragmentation of the notesinstall directory you can use the following command line:
contig -a -v -s "c:\Program Files (x86)\ibm\Notes" > c:\temp\analyze.txt
-a only make an anaylze and do not defrag the files.
-v Verbose
-s Recursive subdirectorys
">c:\temp\anaylze.txt" write the report in the specified file.
The report contains for every file a entry with the count of fragments and a summary at the end:
....
Processing c:\Program Files (x86)\ibm\Notes\nlnotes.exe:
Scanning file...
[Cluster] Runlength
[0] 247
[2140] 150
[3400] 250
File size: 2759272 bytes
c:\Program Files (x86)\ibm\Notes\nlnotes.exe is in 3 fragments
------------------------
Summary:
Number of files processed : 22382
Average fragmentation : 10 frags/file
When you want to really defrag this files then remove the -a option and run the command again.
Contig.exe allows the use of wildcards to select files for defragmentation. So when you want to defrag all your nsf's in the Domino Data directory you can use:
contig -s "c:\Program Files (x86)\ibm\Domino\data\*.nsf"
Friday, March 29, 2013
Wednesday, March 27, 2013
My Top 5 Notes 9 features
There are so many nice improvements in Notes 9, that it was very difficult to choose my top 5, but here they are:
1. The new theme.
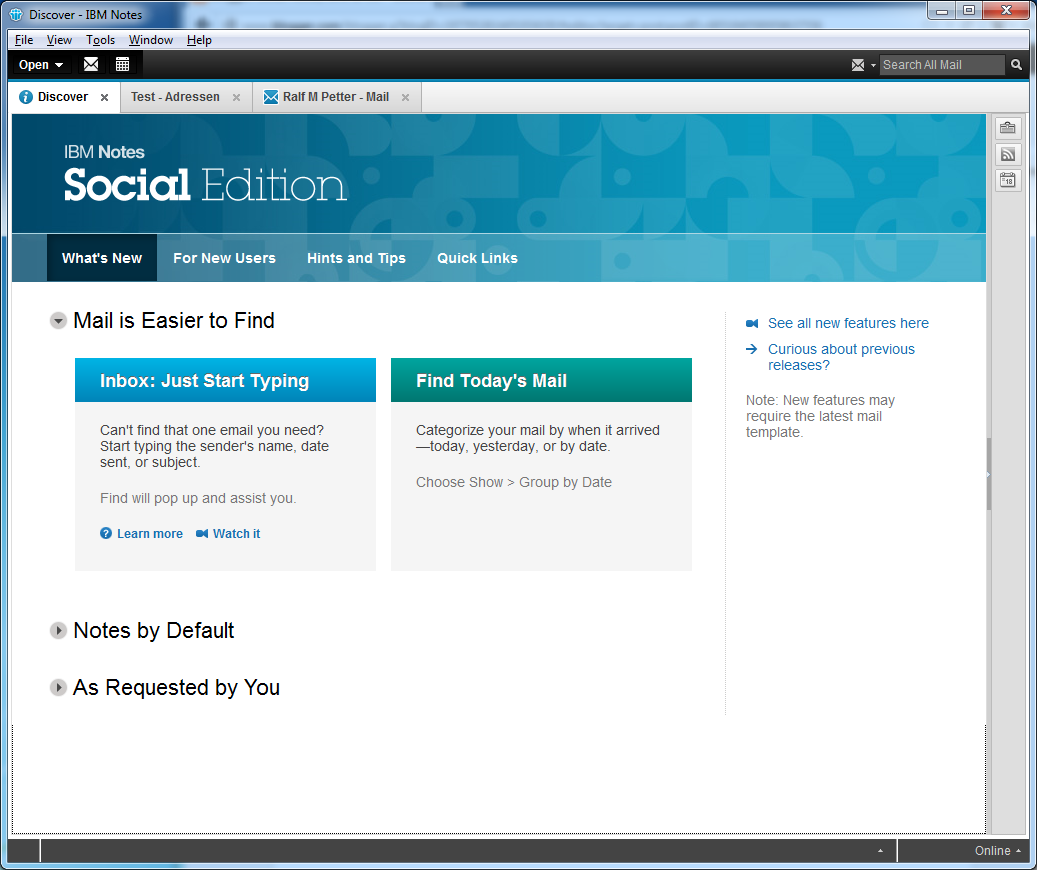
First i was a little worried, about the new grey colour palette and the reduced colours of the icons. But after a short while i really liked the new design and every time i have to go back to my 8.5.3 Notes client at work i think the old theme looks very dated.

1. The new theme.
First i was a little worried, about the new grey colour palette and the reduced colours of the icons. But after a short while i really liked the new design and every time i have to go back to my 8.5.3 Notes client at work i think the old theme looks very dated.
Tuesday, March 26, 2013
How to reports bugs in Notes 9 without a PMR?
Unfortunatly there are some nasty little bugs in Notes 9 and i am searching for an easy way to report this bugs to IBM Development. I do not want to open PMR's because they are to complicated for this little bugs. So does anyone know a way to report bugs like the following to the Development team:
The Typeahead in the new Quickfind dialog does not work, when the "TypeaheadShowServerFirst=1" notes.ini setting is present.
Without the notes.ini setting the typeahead works:
 With "TypeaheadShowServerFirst=1" set the typeahead fails:
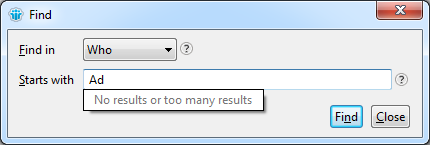
The Typeahead in the new Quickfind dialog does not work, when the "TypeaheadShowServerFirst=1" notes.ini setting is present.
Without the notes.ini setting the typeahead works:
Friday, March 22, 2013
Notes 9 gold the first look is a little bit disappointing
Don't get me wrong, Notes 9 is a big progress over 8.5.3 and it is a good release, but many of the little rough edges i have already criticized in the beta are still in the final version. And this little UI quirks and inconsitences are this things which separate the good from the very good software products. This is especially disappointing because Scott Souder has promised, that significant improvements in this area will be made from beta to gold in a Q&A session at the Edcom Nachlese in munich.
So what are my main complaints about Notes 9 and why do i think that IBM should really work on this stuff.
Many important parts of Notes still look like software from the last century.
The first impression a user gets from the Notes Client is the password dialog. The password dialog has not changed since version 6. It looks like a Windows 2000 dialog and looks really foreign on Windows Vista upwards.

The window tdecoration does not use the style from windows and the dropdown boxes and push button are looking like we are running this software on a very old windows version. By the way all screenshots are from my Windows 7 computer.
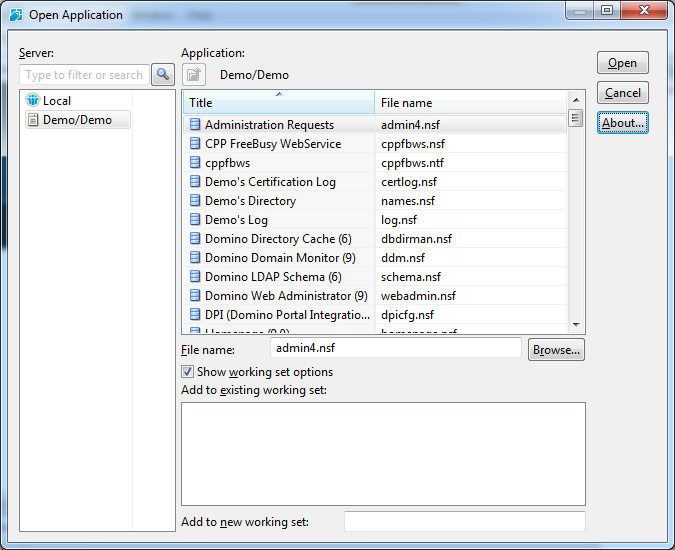
And there are many other places with the same old dialogboxes. And i am not talking from seldom used dialogs. For example look at the "Open Application" dialog.
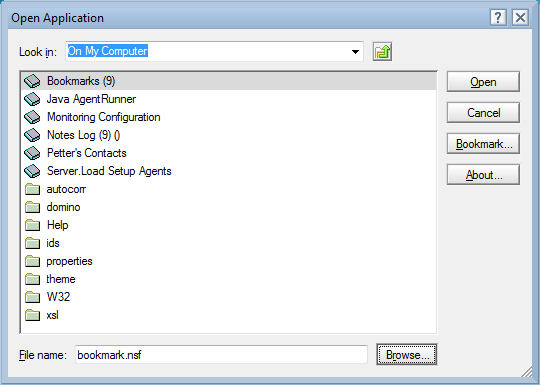
Again the icons are from Notes 6 or older and are complete different to the rest of the icons Notes 9 is using. The window decorators are complete wrong again becaue they are still from Windows 2000 and not fromWindows 7. And the funniest thing is that there is already a new designed "Open Application" dialog and new icons for Applications and folders in the product. This new dialog is used in the Designer client.
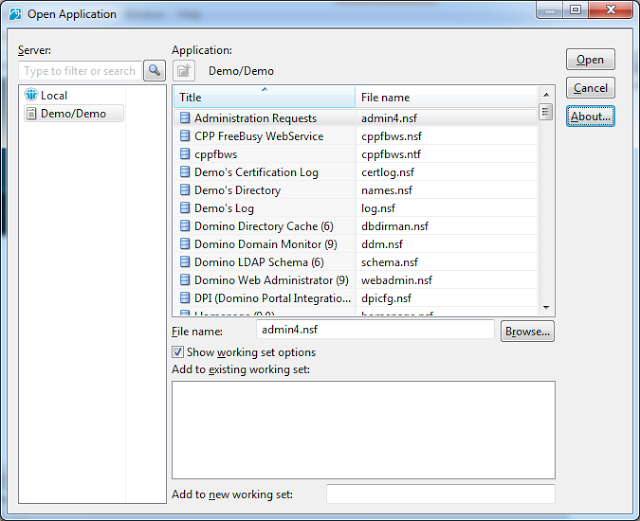
This dialog uses the correct window decorators. The widget set is from Windows 7 and the icons have a fresher look than the old icons in designer. Although there is still room for improvement in the designer dialog too, it would be a good replacement for the open dialog in the client.
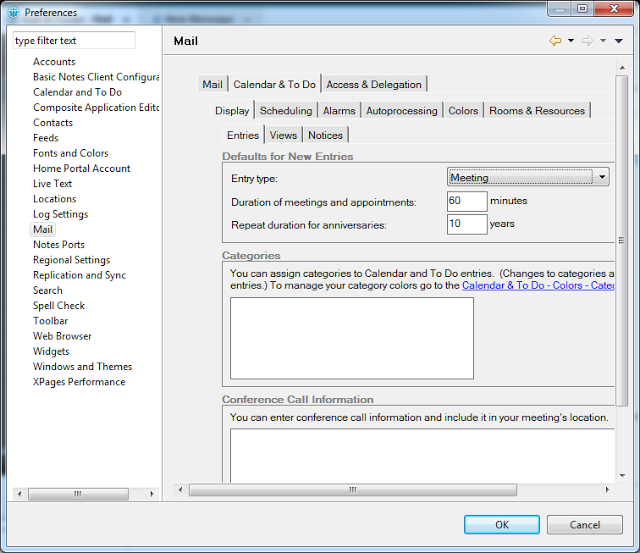
Or lets look at the preferences dialog. Is IBM really thinking that it is a good idea to put an old style notes dialog in an eclipse dialog with scrollbars? I do not think that this is the "exceptional experience" IBM is always promising.
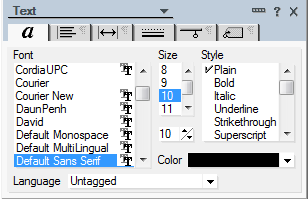
And i can not imagine a reason why the properties dialogs are still not resizable and not redesigned in 2013. Every power user in our company is complaining that it is really ridiculous to use such small and somtimes bad designed dialogs when you want to change a text property or even worse a table property. And again IBM has already proofed that they can do it better with the property sidebars in the productivity editors (Oh if forgot they are discontinued and all my investment in them is gone with them).
So my question is, why has IBM redesigned the already good looking parts like the CA Views and the sidebar if there are still so many very old parts of the product?
The second problem in Notes 9 is that there are so many inconsistencies in the UI.
First of all, i do not know an other application which is using at minimum four different widget styles in one application. For example look at the buttons in Notes:

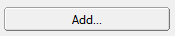


This mix from different widget styles in the same application is a big problem in Notes, because it looks really unprofessional.
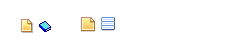
And now an easy one to solve. Notes 9 gold uses still different icons for the same thing.
For example follow up flags in Java View, Dialog, Old View and iNotes. Three different icons for the same purpose in four different places.
 Or the application and doclinks (Notes client vs. iNotes)
 And unfortunatly there are behavior inconsistences all over the whole application.
For example in the new find dialog (by the way, why is this dialog not resizable?) you get help by hovering over the question mark icons and in the mail preferences on the signature tab there is the same question mark icon, but there you have to click the icon to get the tooltip.
Or in the Notes Client you can find the open dialog in "File->Open->IBM Notes Application" and in the designer the same function is under "File->Application->Open". This and many more little differences in behavior make the Notes 9 unpleasant to use.
What is really annoying for customers which use many Eclipse plugins in the notes client is, that the IBM Development team has fogotten to adjust the colour palette in the Eclipse ui framework. So third party plugins look really alien with their blue colours compared to the new grey colour style used in the Notes 9 client.
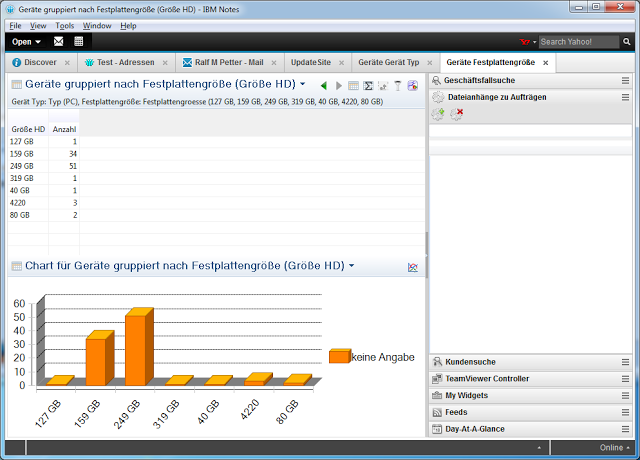
And this would be really easy to change for IBM. I have written a little patch to some of the Notes Client plugins which changes only a few lines of code and third party plugins will look much nicer in Notes 9.
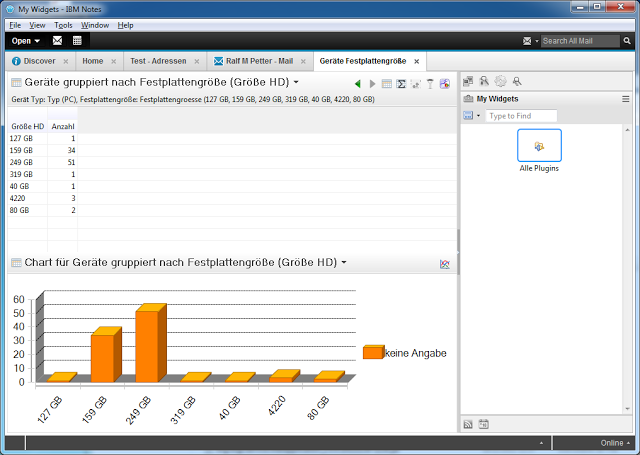
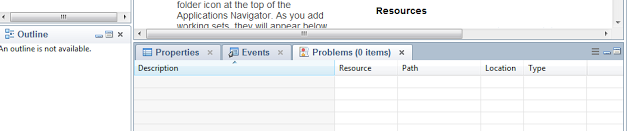
And this is not only a problem in thirdparty plugins . It looks like the same problem is in the Designer Client that some parts of the ui have still the old blue based colour palette.
So the first look is unfortunately a little bit disappointing for me, but i know from the beta that there are many great improvements in the new version. I will show some of this feature in future blog posts.
So what are my main complaints about Notes 9 and why do i think that IBM should really work on this stuff.
Many important parts of Notes still look like software from the last century.
The first impression a user gets from the Notes Client is the password dialog. The password dialog has not changed since version 6. It looks like a Windows 2000 dialog and looks really foreign on Windows Vista upwards.
The window tdecoration does not use the style from windows and the dropdown boxes and push button are looking like we are running this software on a very old windows version. By the way all screenshots are from my Windows 7 computer.
And there are many other places with the same old dialogboxes. And i am not talking from seldom used dialogs. For example look at the "Open Application" dialog.
Again the icons are from Notes 6 or older and are complete different to the rest of the icons Notes 9 is using. The window decorators are complete wrong again becaue they are still from Windows 2000 and not fromWindows 7. And the funniest thing is that there is already a new designed "Open Application" dialog and new icons for Applications and folders in the product. This new dialog is used in the Designer client.
This dialog uses the correct window decorators. The widget set is from Windows 7 and the icons have a fresher look than the old icons in designer. Although there is still room for improvement in the designer dialog too, it would be a good replacement for the open dialog in the client.
Or lets look at the preferences dialog. Is IBM really thinking that it is a good idea to put an old style notes dialog in an eclipse dialog with scrollbars? I do not think that this is the "exceptional experience" IBM is always promising.

And i can not imagine a reason why the properties dialogs are still not resizable and not redesigned in 2013. Every power user in our company is complaining that it is really ridiculous to use such small and somtimes bad designed dialogs when you want to change a text property or even worse a table property. And again IBM has already proofed that they can do it better with the property sidebars in the productivity editors (Oh if forgot they are discontinued and all my investment in them is gone with them).
So my question is, why has IBM redesigned the already good looking parts like the CA Views and the sidebar if there are still so many very old parts of the product?
The second problem in Notes 9 is that there are so many inconsistencies in the UI.
First of all, i do not know an other application which is using at minimum four different widget styles in one application. For example look at the buttons in Notes:
This mix from different widget styles in the same application is a big problem in Notes, because it looks really unprofessional.
And now an easy one to solve. Notes 9 gold uses still different icons for the same thing.
For example follow up flags in Java View, Dialog, Old View and iNotes. Three different icons for the same purpose in four different places.
For example in the new find dialog (by the way, why is this dialog not resizable?) you get help by hovering over the question mark icons and in the mail preferences on the signature tab there is the same question mark icon, but there you have to click the icon to get the tooltip.
Or in the Notes Client you can find the open dialog in "File->Open->IBM Notes Application" and in the designer the same function is under "File->Application->Open". This and many more little differences in behavior make the Notes 9 unpleasant to use.
What is really annoying for customers which use many Eclipse plugins in the notes client is, that the IBM Development team has fogotten to adjust the colour palette in the Eclipse ui framework. So third party plugins look really alien with their blue colours compared to the new grey colour style used in the Notes 9 client.
And this would be really easy to change for IBM. I have written a little patch to some of the Notes Client plugins which changes only a few lines of code and third party plugins will look much nicer in Notes 9.

And this is not only a problem in thirdparty plugins . It looks like the same problem is in the Designer Client that some parts of the ui have still the old blue based colour palette.

So the first look is unfortunately a little bit disappointing for me, but i know from the beta that there are many great improvements in the new version. I will show some of this feature in future blog posts.
Thursday, March 21, 2013
Scott Souder has started his blog.
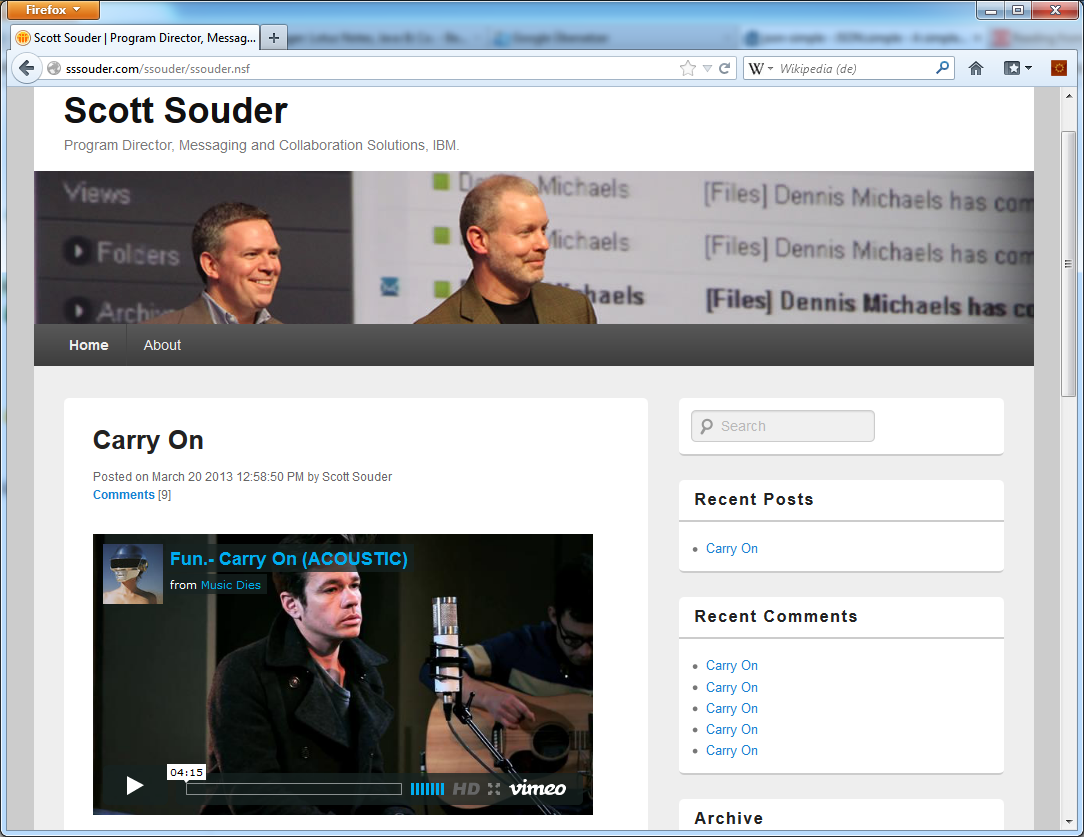
Scott Souder the successor of ed brill in the IBM Messaging and Collaboration division has started his new blog on sssouder.com. I hope his blog will get as informative as the blog of ed brill which was one of the most valuable information source in the IBM collaboration bubble. So good luck to scott souder in his new role and with his new blog.
And by the way, the blog he is using runs on Domino and looks really well.

And by the way, the blog he is using runs on Domino and looks really well.
Lotus Notes 9 final is available in passport advantage
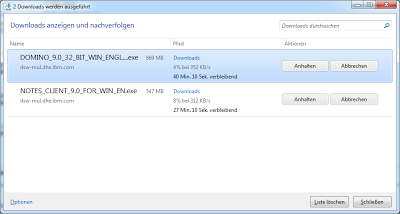
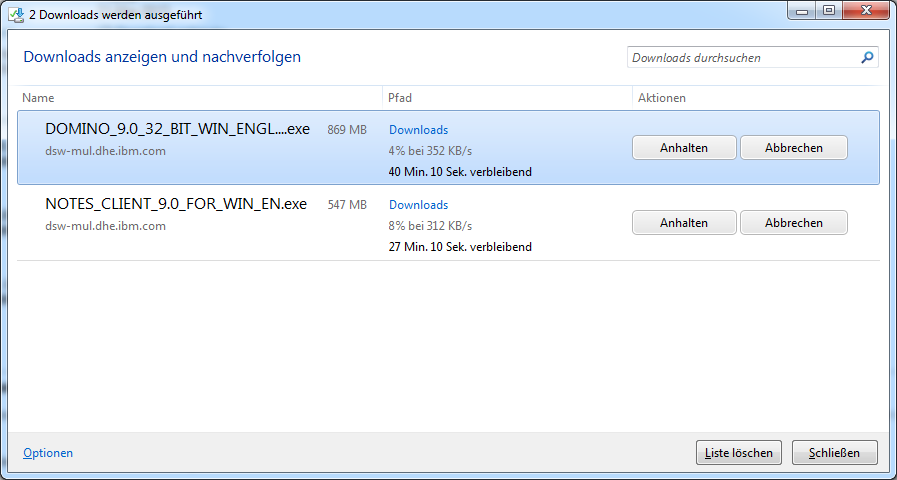
I am so excited that Lotus Notes 9 is available. Now i am downloading the code and will post what has changed since the public beta later today.
The product codes for the most important downloads are:
IBM Notes, Domino Designer and Admin V9.0 for Windows XP,Vista and Windows 7 32 Bit English(CIB9AEN)
IBM Notes Client V9.0 for Windows English(CIB8LEN)
IBM Notes Client V9.0 for Mac English(CIB8PEN)
IBM Notes Client V9.0 for Linux (RPM Install) English(CIB8MEN)
IBM Notes Client V9.0 for Linux (Debian Install) English(CIB8NEN)
IBM Notes Traveler V9.0 for Windows Multilingual(CIB95ML)
IBM Domino Sever V9.0 64 bit for Windows English(CIBM1EN)
IBM Domino Sever V9.0 32 Bit for Windows English(CIBM0EN)
Monday, March 18, 2013
Very cool! Conditional breakpoints in the SSJS Debugger
I blogged about the new SSJS Debugger in Designer 9 and how to use it to find bugs in your java script code some weeks ago. And today i want do show you how to use conditional breakpoints in the new debugger.
Every developer knows that it is very annoying when you have a problem in a loop which occurs only in a particular iteration. So you have to step through the loop many times only to get to the faulty iteration. And when you click step over one time to often you can start from the beginning. Look at the following example:
We are looping through a view and make a litte calculation. When we run this example we get a value of "inifinty". So we are pretty sure that on one iteration there is a Division by zero. But the big question is which document contains the zero value? So we can step through the whole loop to find the doc which contains a zero vale or define a conditional breakpoint.
1. Go to the source tab of your xPage.
2. Left click the breakpoint area left of the line numbers to define a breakpoint.
3. Right click the new breakpoint and select "Breakpoint Properties"
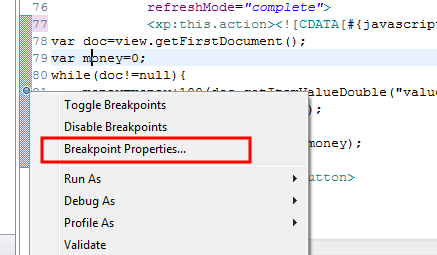
4. Define the condition when your breakpoint should stop the script execution
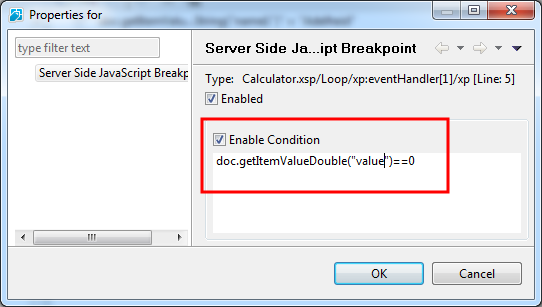
After the condition is set the SSJS Debugger will stop the script execution every time the code where the break point is defined is executed and the condition is true. In our example stops the execution when doc.getItemValueDouble("value") is 0. When the Execution stops you can find out with the expressions view which document is causing the error. For example you can get with doc.getUniversalID() the UNID from the document with the 0 value.
Condtional breakpoints are a very valuable tool to find bugs in complex SSJS code.
Reference to all my posts about the SSJS Debugger
Every developer knows that it is very annoying when you have a problem in a loop which occurs only in a particular iteration. So you have to step through the loop many times only to get to the faulty iteration. And when you click step over one time to often you can start from the beginning. Look at the following example:
var view=session.getCurrentDatabase().getView("Employees");
var doc=view.getFirstDocument();
var money=0;
while(doc!=null){
 money=money+100/doc.getItemValueDouble("value");
 doc=view.getNextDocument(doc);
}
getComponent("result").setValue(money);
We are looping through a view and make a litte calculation. When we run this example we get a value of "inifinty". So we are pretty sure that on one iteration there is a Division by zero. But the big question is which document contains the zero value? So we can step through the whole loop to find the doc which contains a zero vale or define a conditional breakpoint.
1. Go to the source tab of your xPage.
2. Left click the breakpoint area left of the line numbers to define a breakpoint.
3. Right click the new breakpoint and select "Breakpoint Properties"
4. Define the condition when your breakpoint should stop the script execution
After the condition is set the SSJS Debugger will stop the script execution every time the code where the break point is defined is executed and the condition is true. In our example stops the execution when doc.getItemValueDouble("value") is 0. When the Execution stops you can find out with the expressions view which document is causing the error. For example you can get with doc.getUniversalID() the UNID from the document with the 0 value.
Condtional breakpoints are a very valuable tool to find bugs in complex SSJS code.
Reference to all my posts about the SSJS Debugger
Saturday, March 16, 2013
How to activate and use the expressions view in the SSJS debugger
The "expressions" view in the java debugger is one of the most valuable tool for debugging java code. With this view you can deeply inspect the values of all objects you are using in your code at runtime and you can even run methods on this object to get values not visible in the standard "variables" view. For example when you have a document object you can invoke getItemValueString on this object to get the value of a field from the document. Knowing this you will understand my disappointment when i first try the SSJS Debugger in Desinger 9, because it looks like there is no expression view in the java script debugger. But fortunately the view is only hidden and can be activated in Designer 9.
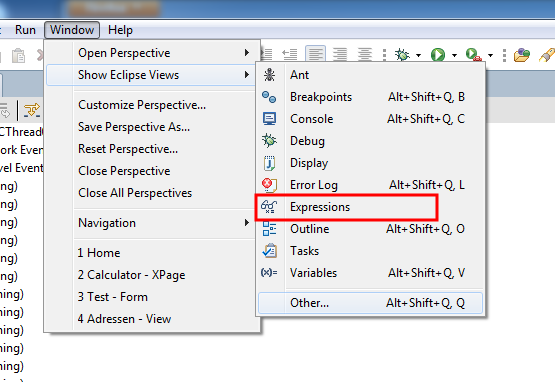
Go to the "Window->Show Eclipse View" menu and activate the "expressions" view.
 After that we can use the expressions view to analyze the state of all objects available in our code when the execution is stopped at a breakpoint in the debugger.
For example we have the following serverside java script code in our xPage.
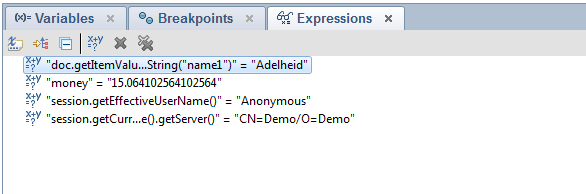
The following screenshot shows what is possible with the expressions view in SSJS Debugger at a brekpoint inside the loop.
 You can access every field from the doc Object with getItemValueString() or every java script variable. You can get every information from the session, for example the effective username running this script. From the session you can acces databases and from the databases you cann acess views and so on and on. The possibilitys are endless.
 To add, change or remove expressions in the expression view simply right click the view and select the appropriate menu action. Or use the actions in the toolbar. When you hove over a toolbar icon you get a simple description of the action.
So i hope IBM will activate the expressions view by default in future service packs of Designer 9 so that every xPage developer knows about this great tool. A right click Option "Watch this expression" in the source editor would be nice too.
Reference to all my posts about the SSJS Debugger
Go to the "Window->Show Eclipse View" menu and activate the "expressions" view.
For example we have the following serverside java script code in our xPage.
var view=session.getCurrentDatabase().getView("Employees");
var doc=view.getFirstDocument();
var money=0;
while(doc!=null){
 money=money+100/doc.getItemValueDouble("value");
 doc=view.getNextDocument(doc);
}
getComponent("result").setValue(money);
The following screenshot shows what is possible with the expressions view in SSJS Debugger at a brekpoint inside the loop.
 To add, change or remove expressions in the expression view simply right click the view and select the appropriate menu action. Or use the actions in the toolbar. When you hove over a toolbar icon you get a simple description of the action.
So i hope IBM will activate the expressions view by default in future service packs of Designer 9 so that every xPage developer knows about this great tool. A right click Option "Watch this expression" in the source editor would be nice too.
Reference to all my posts about the SSJS Debugger
Subscribe to:
Posts (Atom)
ad