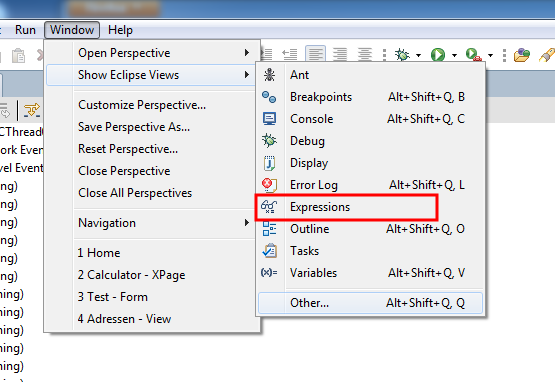
Go to the "Window->Show Eclipse View" menu and activate the "expressions" view.
After that we can use the expressions view to analyze the state of all objects available in our code when the execution is stopped at a breakpoint in the debugger.
For example we have the following serverside java script code in our xPage.
var view=session.getCurrentDatabase().getView("Employees");
var doc=view.getFirstDocument();
var money=0;
while(doc!=null){
 money=money+100/doc.getItemValueDouble("value");
 doc=view.getNextDocument(doc);
}
getComponent("result").setValue(money);
The following screenshot shows what is possible with the expressions view in SSJS Debugger at a brekpoint inside the loop.
You can access every field from the doc Object with getItemValueString() or every java script variable. You can get every information from the session, for example the effective username running this script. From the session you can acces databases and from the databases you cann acess views and so on and on. The possibilitys are endless.
 To add, change or remove expressions in the expression view simply right click the view and select the appropriate menu action. Or use the actions in the toolbar. When you hove over a toolbar icon you get a simple description of the action.
So i hope IBM will activate the expressions view by default in future service packs of Designer 9 so that every xPage developer knows about this great tool. A right click Option "Watch this expression" in the source editor would be nice too.
Reference to all my posts about the SSJS Debugger


No comments:
Post a Comment