So in today's post i want to show you how you can trace your communication and export the traced data to the best open source network traffic analyzer Wireshark:
1. Start a communication trace
STRCMNTRC CFGOBJ(ETHLINE) CFGTYPE(*LIN) MAXSTG(64M)
Replace "ETHLINE" with the name of the Network line which you want to trace. If you get the error CPF39A6 you can either reduce the MAXSTG parameter or create a bigger comm trace area in the system service programs.
2. Reproduce your problem.
3. End the communication trace.
ENDCMNTRC CFGOBJ(ETHLINE) CFGTYPE(*LIN)
4. Dump the Communication Trace to the IFS in PCAP format
DMPCMNTRC CFGOBJ(ETHLINE) CFGTYPE(*LIN) TOSTMF('/tmp/commtrace') REPLACE(*YES) FORMAT(*PCAP)
Replace "ETHLINE" with the name of the Network line which you want to trace and the TOSTMF Parameter with the path in the IFS where you want to export your comm trace. The IFS path should be available as Windows share to clients over Netserver.
5. Open Wireshark and choose the option to open the previous captured file from the IFS.
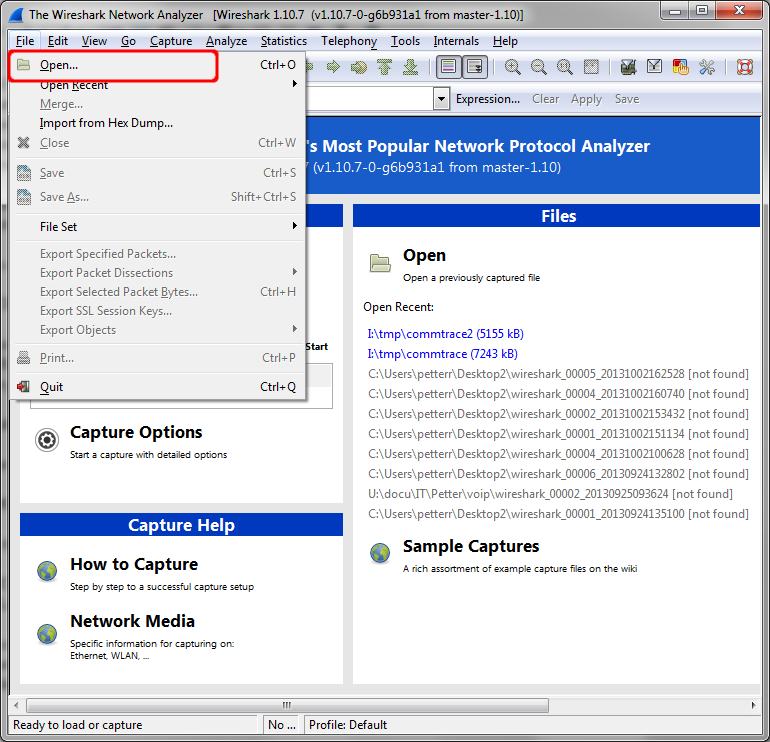
Now you can filter and analyze your problem with the most advanced open source network analyzer available.
Neat. Thank you. I was familiar with both STRCMNTRC and Wireshark, but did not realize I could use them together... :-)
ReplyDelete